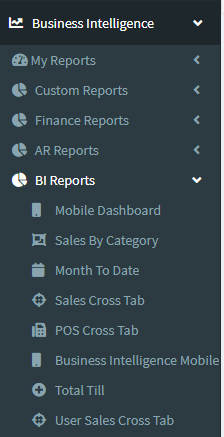
1. Go to the back-office and click on the option Business Intelligence - BI Reports and then click on the option Sales By Category.
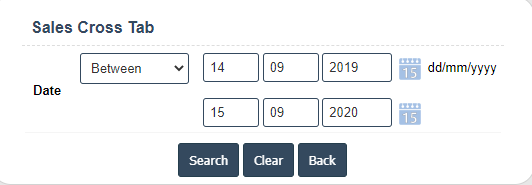
2. Select the date.
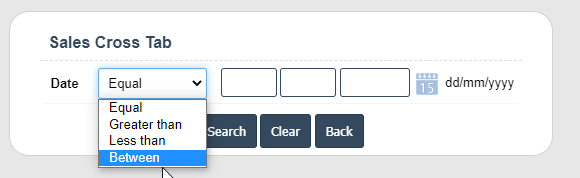
3. If you selected the between write the date difference then search.
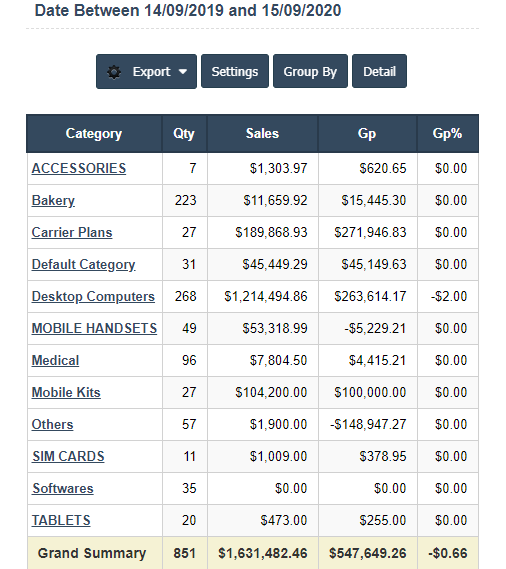
4. View the Sales By Category Report.